How did the 2026 rainfall in Kruger compare with previous years?
The beginning of 2026 brought heavy rainfall to many parts of Kruger National Park (KNP), with unusually high rainfall recorded, which led to widespread flooding in several areas. With so much rain falling over a relatively short period, many people wondered how this event compared with some of the major floods experienced in the past, particularly the well-remembered floods of 1999/2000.
Fortunately, KNP has a remarkably long history of rainfall monitoring. Rainfall has been recorded at stations across the park for many decades (Figures 1 and 2), with some records extending as far back as 1910. These long-term datasets provide an invaluable perspective on current rainfall events, allowing us to see not only how much rain has fallen in a particular year but also how unusual that rainfall is when compared with more than a century of observations.
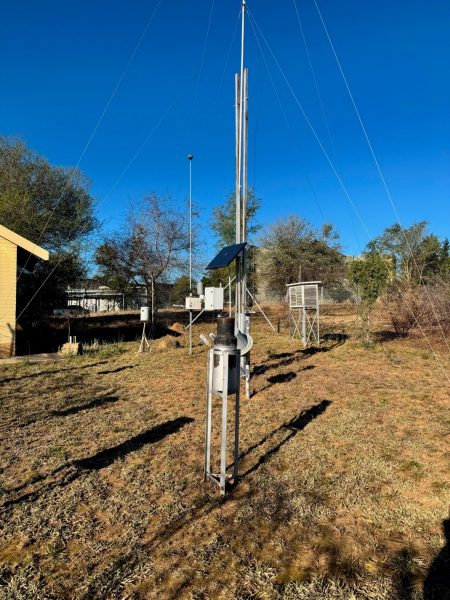
Figure 1: Illustration of a climatic station with the rainfall gauge in the foreground
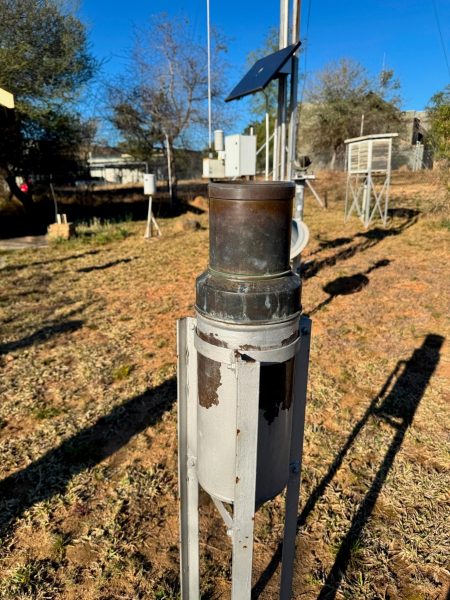
Figure 2: Close-up of the metal rainfall gauge
Putting the 2026 rainfall into perspective
Each year, a park-wide average rainfall is calculated for the 12-month rainfall period ending in July. This period is called a climatic year and allows rainfall from individual stations across KNP to be combined to provide an indication of conditions across the park as a whole.
Although several parts of Kruger received much higher than normal rainfall during the beginning of 2026, the park-wide average for the year did not exceed the rainfall recorded during the 1999/2000 flood year. This may be surprising, but there are a few reasons for this. Firstly, during the exceptionally heavy rainfall in January 2026, personnel had to be evacuated from several rainfall-recording stations. As a result, some rainfall observations could not be collected. This means the recorded totals at these stations are likely lower than the actual rainfall. Secondly, rainfall was also not equally high across the entire park. While some areas experienced exceptional rainfall, many stations in southern Kruger received considerably less rainfall than they did during the 1999/2000 rainfall year. When rainfall is averaged across the whole park, these regional differences become important as the higher values are lessened when all readings are averaged. Thirdly, this data does not account for the rainfall which fell outside the park, which contributed significantly to the flooding impacts observed inside the park.
An exceptionally wet year nonetheless
Although the 2026 park-wide rainfall was slightly lower than that recorded in 1999/2000, it was still significantly above the long-term mean annual rainfall of 551.4 mm.
The first graph below (Figure 3) places the latest rainfall year within the much longer rainfall record for Kruger. Years with rainfall above the long-term average are shown in blue, while those below the average are shown in red. This makes it possible to see just how variable rainfall has been across the park over more than a century, and how the recent rainfall compares with previous exceptionally wet years.
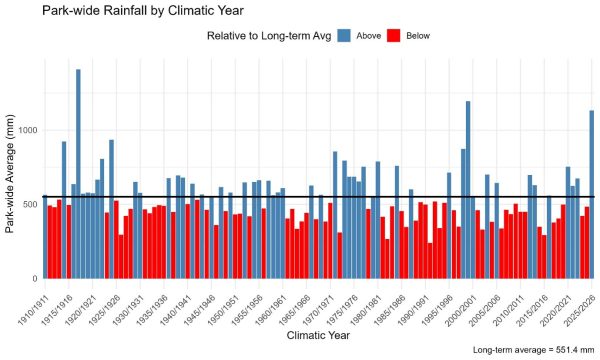
Figure 3. Graph showing park-wide average rainfall for each Climatic Year starting in 1910 and ending in 2026.
The second graph (Figure 4) provides another way of viewing this variability, showing how far annual rainfall was above or below the long-term mean. It highlights periods of abundant rainfall as well as below-average and drought years, illustrating the considerable climatic variability that has characterised Kruger over time.
Importantly, the high rainfall recorded this year has also influenced the park’s overall long-term rainfall statistics. The inclusion of the latest rainfall year increased the calculated mean annual rainfall by approximately 5 mm. Although 5 mm may sound relatively small, a change of this magnitude in a mean calculated from such a long historical record is substantial.
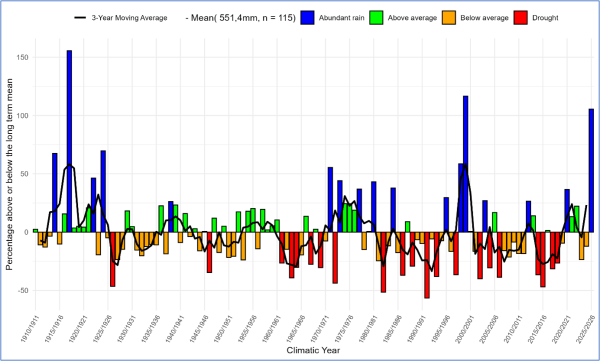
Figure 4 Graph showing yearly rainfall above or below the long term mean from 1910 until 2026
Why long-term rainfall monitoring matters
Events such as the 2026 rains demonstrate why maintaining long-term environmental monitoring programmes is so important. A single wet or dry year tells us about conditions at a particular point in time, but a rainfall record extending over more than a century allows us to place those events into perspective. It helps us distinguish an unusually wet year from an unprecedented one, identify periods of drought and high rainfall, and understand how rainfall patterns vary through time. Kruger’s long-term rainfall records therefore represent much more than a historical archive. They provide an increasingly valuable dataset for understanding environmental change and interpreting the climatic conditions affecting the park’s ecosystems.

